Guides
Former homes map, one decision at a time
Former homes map research: use Sanborn atlases, USGS topographic maps, aerial photos, and lidar to compare a building across editions.
Old maps are the closest thing to a time series a building has. A single historic map shows a footprint on a date. Two of them, twenty years apart, show what was added, what was demolished, what was subdivided and what was rebuilt. Nothing else available to a researcher gives that so cheaply.
This former homes map guide focuses on series that record buildings and on how to compare them. It identifies no property, and everything described is held in public collections.
A former-home map, one decision at a time
- Choose the question.Are you tracing a footprint, a parcel split, or changes to the grounds? That determines which map series can answer it.
- Find a map for the place.Search the Library of Congress Sanborn Maps collection for an urban building; also check municipal and county atlas holdings and the USGS Historical Topographic Map Collection.
- Choose a second view.Use aerial photography to check what stood between map editions, or lidar to look for surviving ground features. Coverage varies by place.
- Record dates and compare.Note the edition date on every sheet, compare the same location, and treat a change as occurring within the interval between editions.
- Check the explanation.Compare map-based conclusions with state or local survey records, Historic American Buildings Survey documentation, or a National Register nomination file.
What to take away
- The value of historic mapping is comparativeone sheet is a fact, two sheets are a history.
- Fire insurance atlases are the richest source for building fabric, because they were drawn to record construction rather than geography.
- Survey inventories, which are not maps, are usually the missing piece that explains what the maps show.
The series worth knowing
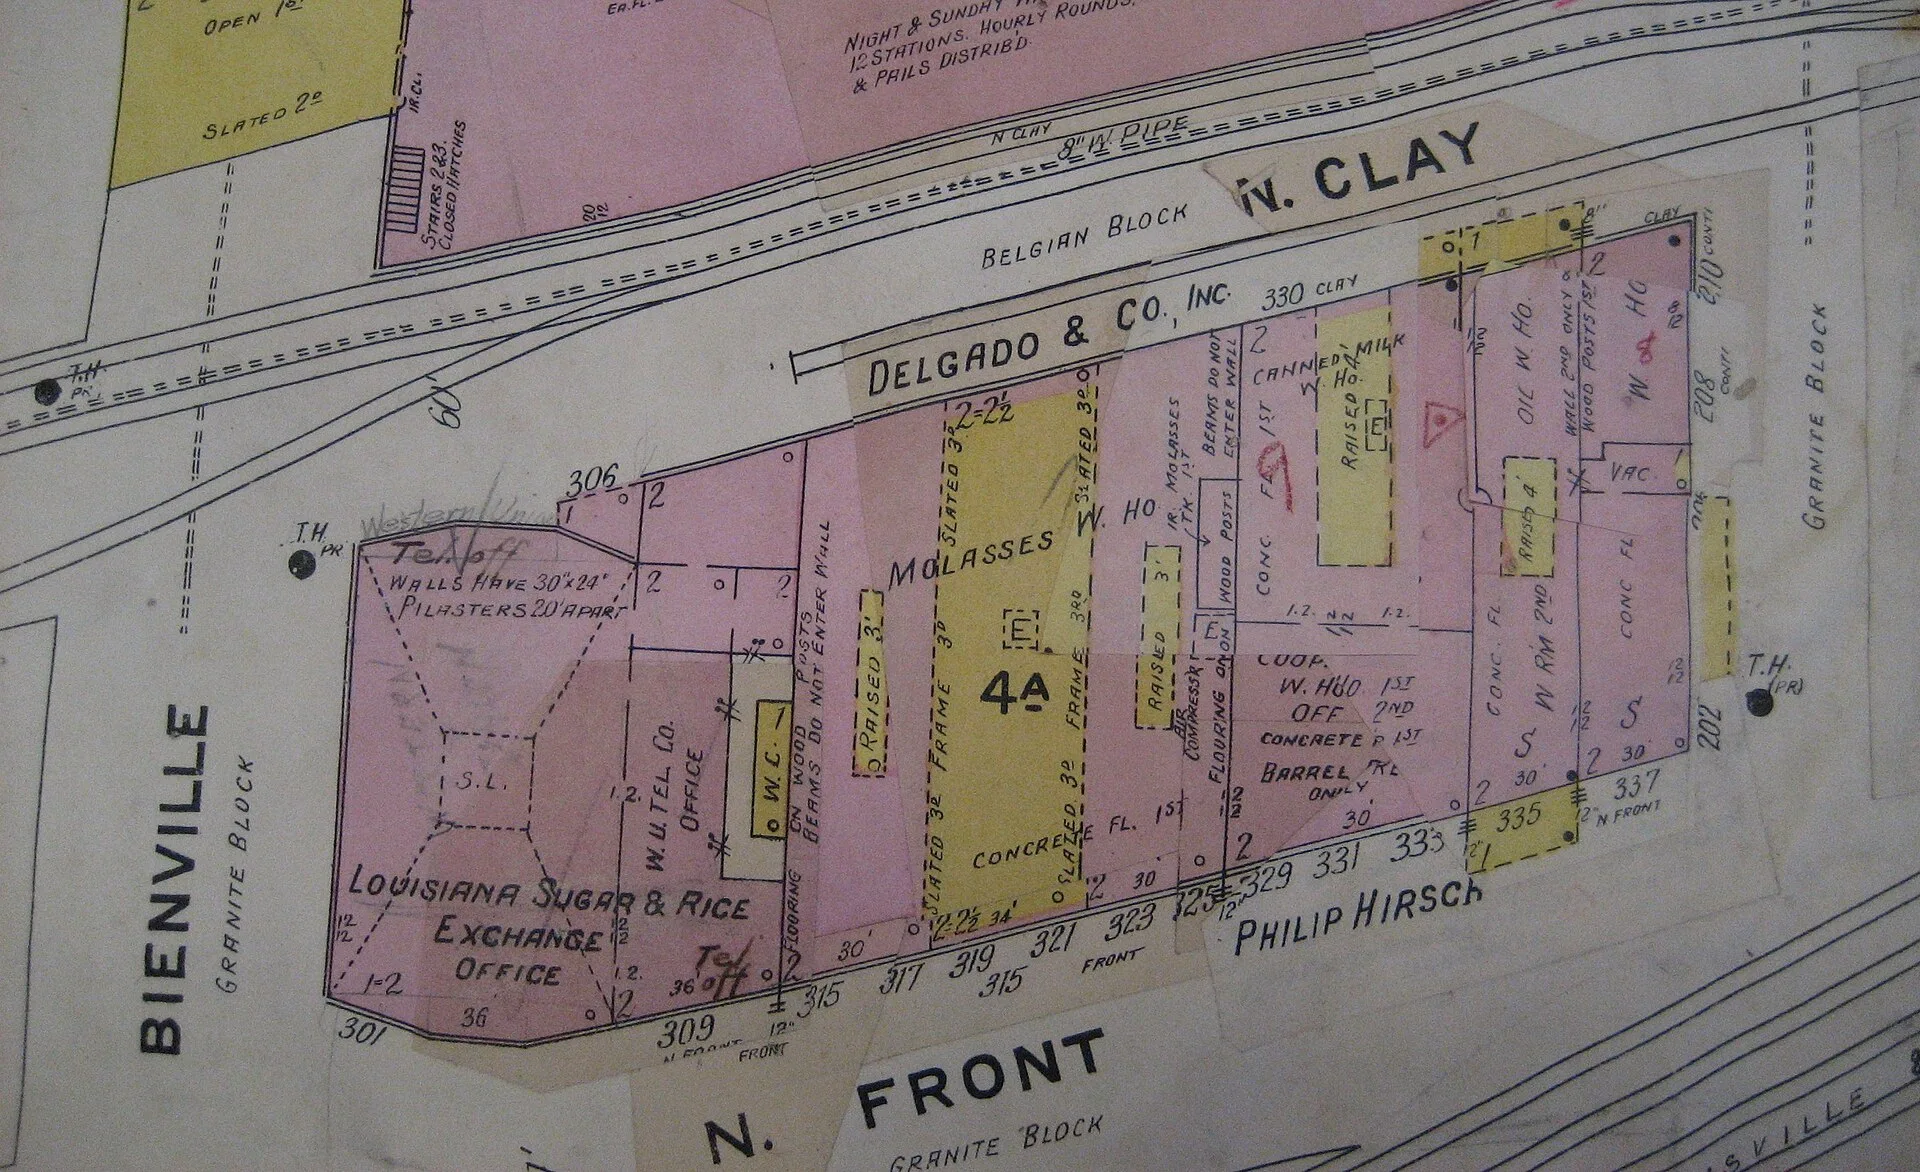
Fire insurance atlases. A central series to search is the Sanborn Fire Insurance Maps. Drawn block by block for underwriting purposes, they record building footprint, number of stories, construction material, roof type, and often the use of each structure. The Library of Congress Sanborn Maps collection is one place to search; holdings and revisions vary by location. Because sheets were revised by pasting corrections onto existing pages, a single volume can carry several dates at once, which is a feature if you notice it and a trap if you do not.
Topographic series. U.S. Geological Survey (USGS) topographic mapping records terrain, drainage, roads, and settlement over long runs of editions. The USGS Historical Topographic Map Collection provides a place to search historic editions; note the edition date printed on each map. These maps are coarse for individual buildings and unmatched for understanding a site's setting and how access to it changed. Current products and historic series are distributed through the National Map.
Municipal and county atlases. Property atlases drawn for tax or engineering purposes show parcel lines, which is what you need to see subdivision happening. Search the Library of Congress Geography and Map Division catalog by place and publisher for atlases, including those by Hexamer and Perris. County atlases may also be held by county archives and local libraries.
Aerial photography. Historic aerial photographs can be searched through USGS EarthExplorer; the USDA National Agriculture Imagery Program (NAIP) is another source of aerial imagery. Coverage and available years vary by location, so check county archives or local GIS programs for additional flight imagery. Aerials give a record of what stood, what was demolished, and how grounds were used. They also record the things maps omit: yards, plantings, tracks, and temporary structures.
Terrain survey. Modern lidar shows the ground surface beneath vegetation, which can reveal earthworks, old drives, terraces, foundations, and field boundaries. For U.S. data, start with the USGS 3D Elevation Program (3DEP) and search OpenTopography; state geospatial-data portals may also offer lidar surveys.
Reading two editions together
| What changed between editions | Likely explanation |
|---|---|
| Footprint grew at the rear | Service or kitchen addition, the commonest single change |
| Footprint shrank | Demolition of a wing, usually service accommodation |
| Building split by a new line | Subdivision into separate properties |
| A structure vanished from the yard | Loss of stables, coach house, or outbuildings |
| Parcel boundary moved | Land sold off; often the real change in the property's history |
| Construction notation changed | Rebuilding after fire, or a recorded upgrade |
The discipline is to record the edition date of every sheet you use and to treat the interval between two editions as the uncertainty. A change appearing between a sheet from one decade and a sheet from the next happened somewhere in that window and not necessarily at either end.
Where the explanation comes from
Maps show what changed. They almost never show why. Explanations may be in state and local survey records, National Register of Historic Places nomination files, and the survey and designation files, including researched descriptions of individual buildings, measured drawings, and photographs produced by documentation programs.
The federal documentation programs are the best single introduction to what a serious building record contains. The National Park Service's Heritage Documentation Programs include the Historic American Buildings Survey (HABS); see the Heritage Documentation Programs, with the buildings survey itself at what the Historic American Buildings Survey records. A measured drawing gives a plan, a section, and details, which together settle questions a footprint cannot touch.
State and city survey files matter more than people expect, because far more buildings have been surveyed than designated. Start with your state's official State Historic Preservation Office (SHPO) survey inventory; city or county preservation and planning offices and archives may hold local records. For a listed property, consult its National Register of Historic Places nomination file through the National Park Service or the relevant SHPO. How to find which office holds what is set out in finding the right office, and how the resulting national file is organized is covered in reading the record calendar.
Reading the building itself against what the maps say is the other half of the work, and the method for that is in former lives of buildings. How the same layer-stacking approach applies to a modern city is in reading a city's public map layers.
Common questions
How do I date a sheet that has been revised?
Look for the pasted correction. Revised atlas sheets show different paper, different ink and a boundary at the edge of the patch. The base sheet and the patch have different dates, and the volume's title page gives only one of them.
Are old maps accurate about building shape?
Fire insurance atlases are unusually good, because inaccuracy cost the insurer money. General topographic mapping generalizes buildings heavily and should not be used for footprint detail.
What if a building appears on one map and not the next?
It may be demolished, or it may be below the size threshold for that series, or the sheet may be a partial revision. Check a third source before concluding a demolition.
Can these maps be used to locate a current private home?
This site does not publish anything that locates a private home. Historic mapping is a tool for understanding how a place changed, and that is how it is used here.